


Explore our library of webinars, case studies and articles designed to help you solve microbial challenges with clarity and confidence. From practical how-tos to in-depth research, these resources give you the knowledge to make better decisions, faster.
Protect Performance, Preserve Production: The Operator’s Guide to Microbial Risk Management
Bugcount , Genecount , Labs , Polytechnic , Relay ,
Stay ahead of MIC , Keep source water clean , Protect reservoir quality , Prevent biofilm build-up , Optimize biocide performance , Unified testing and reporting ,
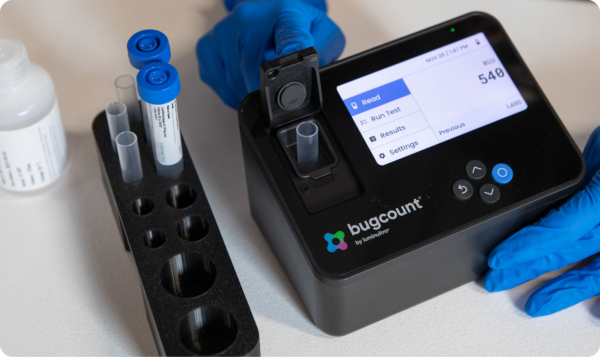
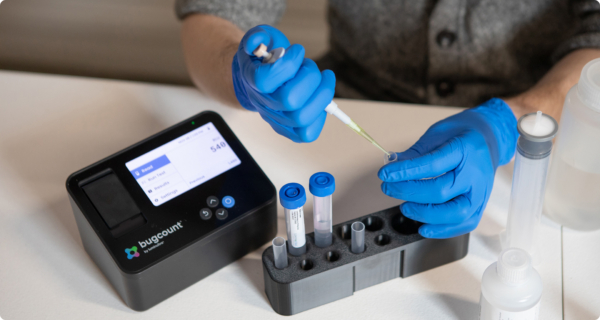
Luminultra introduces the Bugcount® analyzer ATP measurement platform, redefining the standard in microbial testing
The company’s flagship product combines 30 years of microbial expertise with trusted user feedback to produce a next-generation device built to streamline testing, accelerate decisions and strengthen control across critical systems.
Bugcount ,
Wastewater treatment , Drinking water , Legionella management , Microbial contamination , Efficiency loss and biofilm buildup , Biocide management and optimization , Protect product quality , Keep lines running , Stay ahead of MIC , Keep source water clean , Protect reservoir quality , Prevent biofilm build-up , Optimize biocide performance , Commercial aviation , Non-commercial aviation , Marine , Fuel storage ,
We bring microbial expertise and deep industry knowledge together to help you solve complex challenges and make confident decisions.


Whether you’re in the lab or in the field, we’re here to help you keep the work on track.

I need help getting started
Have a general inquiry or just need some direction? Send us your question and we’ll get you an answer
I need customer support
Need help with a product or test? Our customer experience team can help

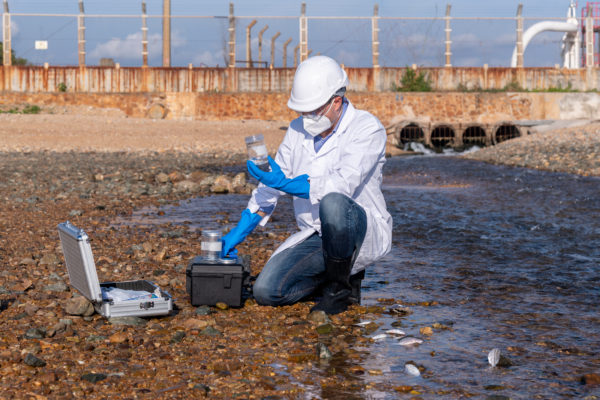
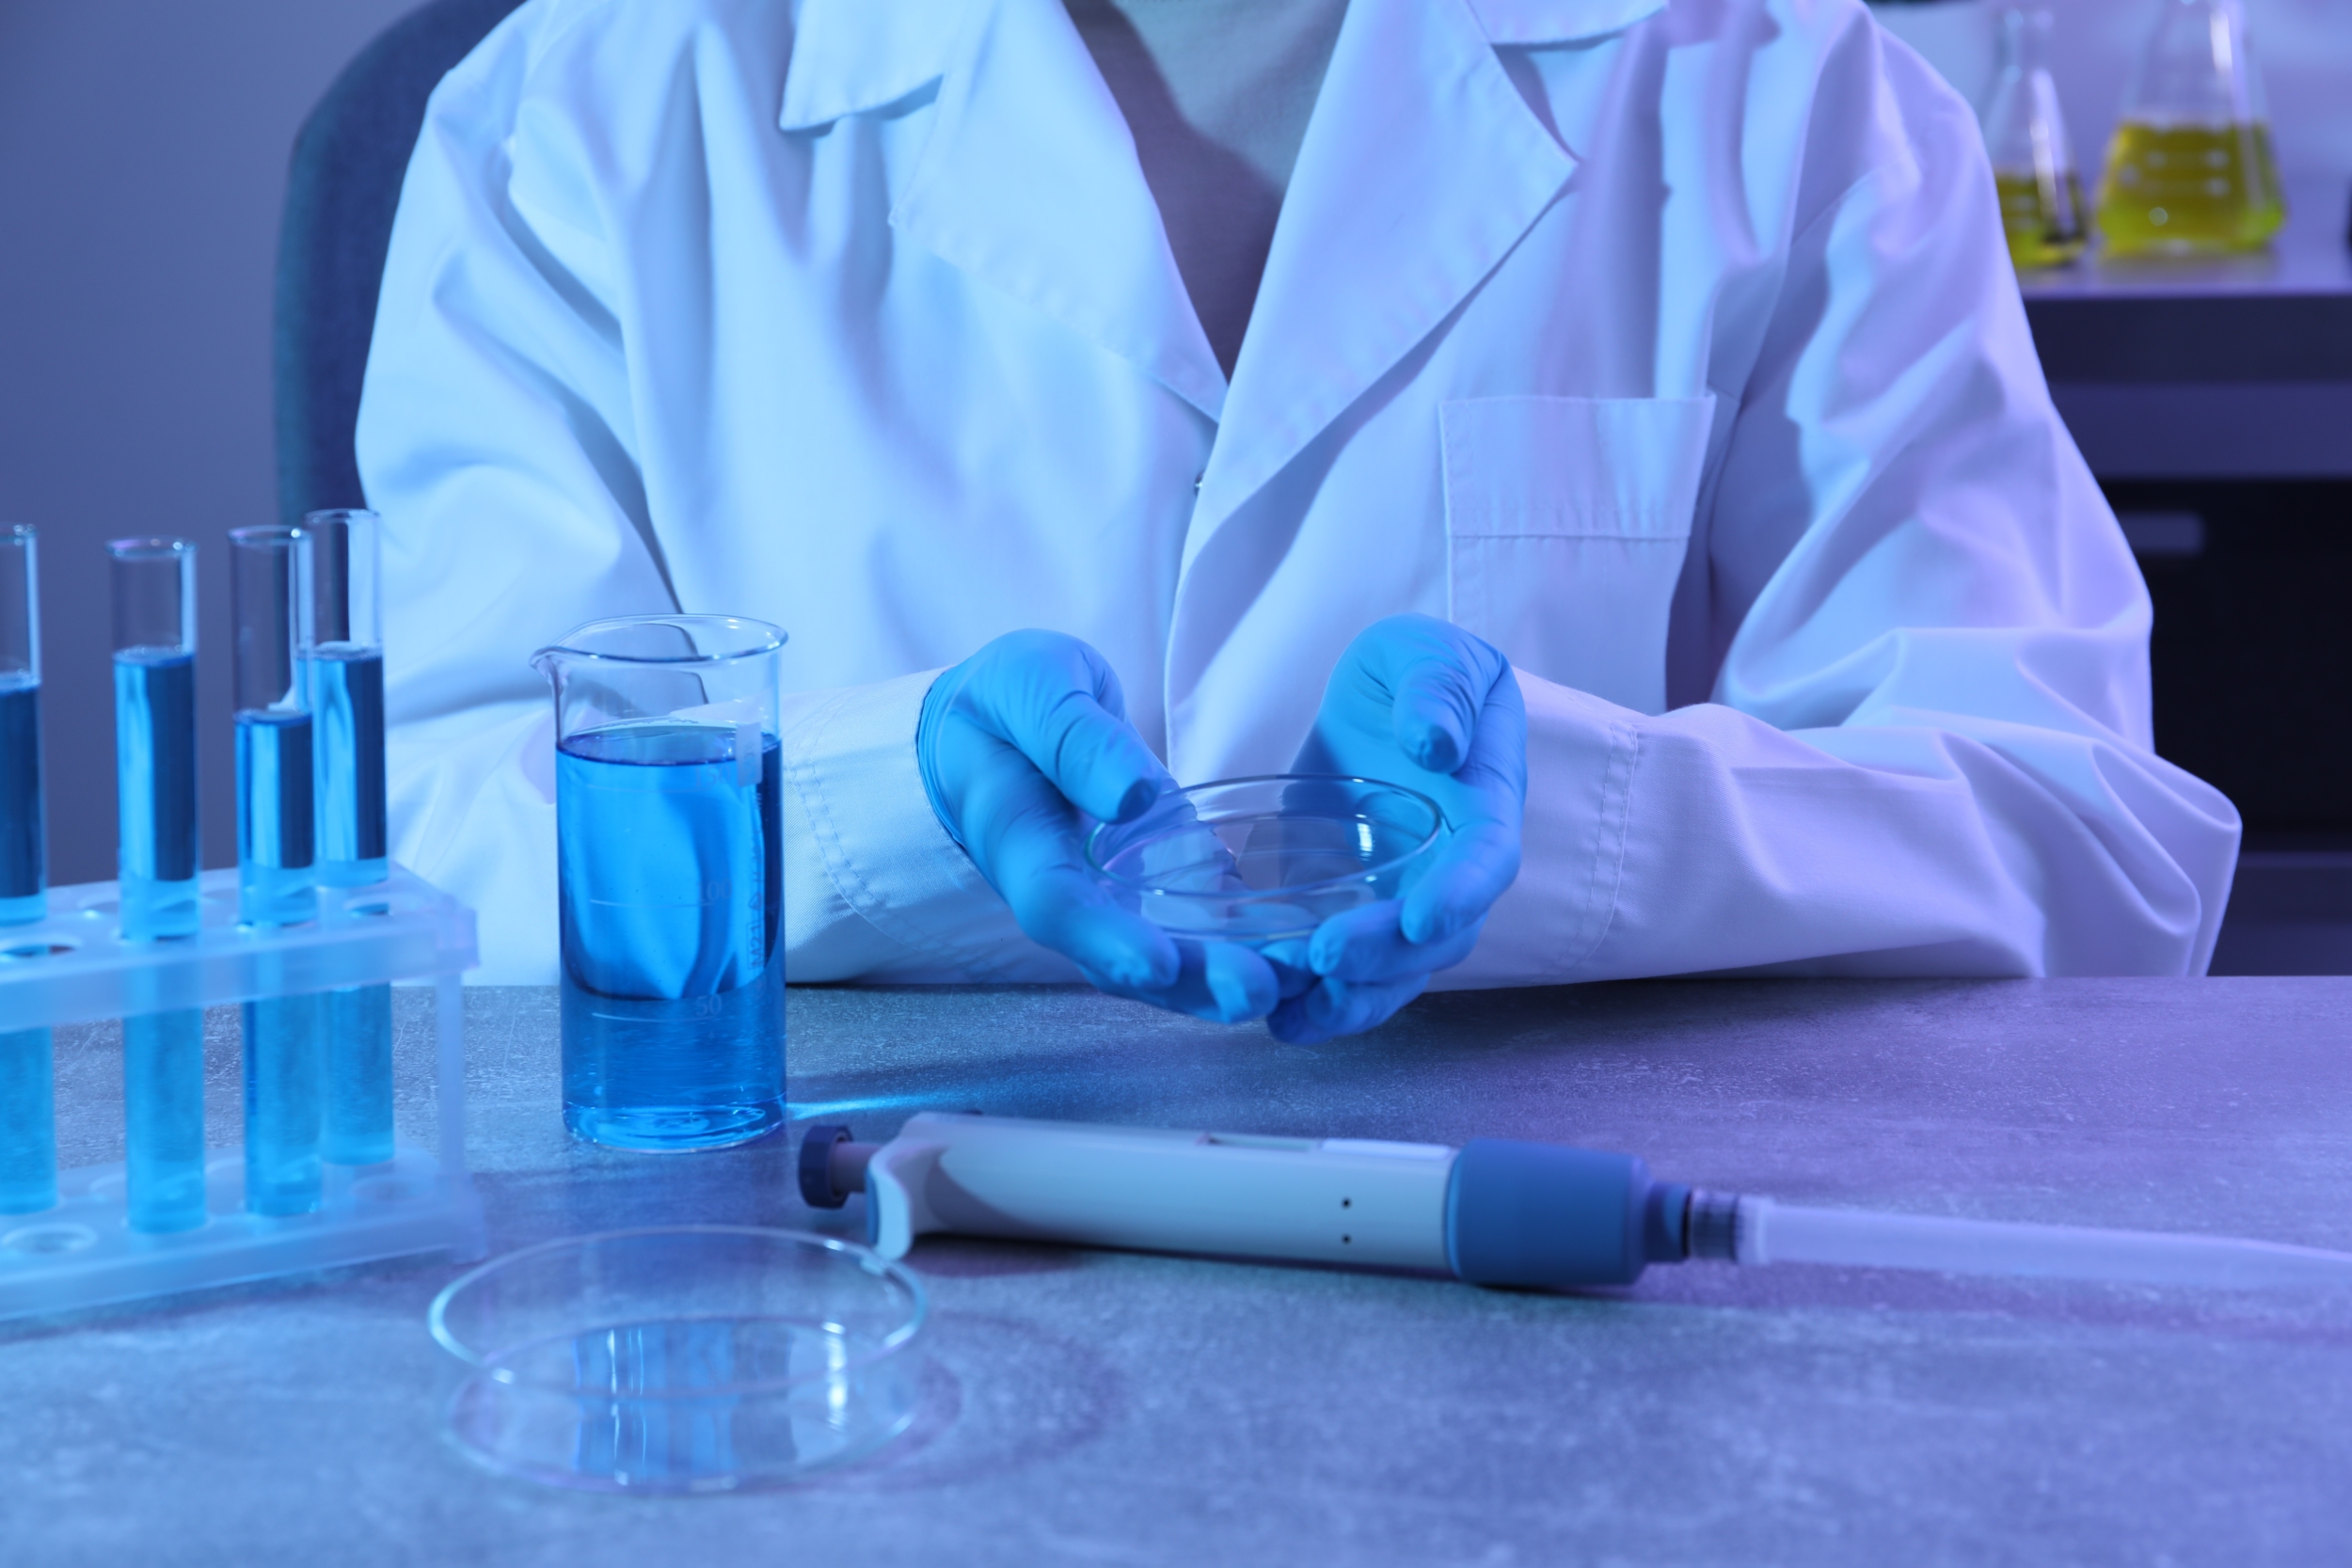
Why won’t total microbial content decrease after UV treatment?
Compared to chlorine, which destroys the cell membrane, UV treatment is a physical process where UV light mutates and/or degrades DNA and RNA in bacterial and viral cells.
UV treatment only recently became widely adopted in the water and wastewater treatment industries but the benefits of sun exposure for water purification have been acknowledged for thousands of years. Ancient Sanskrit and Greek writings dating as far back as 4,000 B.C. identify exposure to sunlight as one of the recommended water treatment methods to improve the taste, odor, and clarity of drinking water. It wasn’t until the mid-1800’s however, with John Snow’s theory on cholera transmission and Robert Koch’s agar development, that we began to identify microbiological pathogens and the risks associated with them. In 1877, the germicidal properties of sunlight were discovered by Downes and Blunt and in 1910 in Marseilles, France, the first UV disinfection system for drinking water was operated. UV disinfection was still slow to gain traction in the industry until the 1970’s with the discovery of disinfection by-products (DBPs).
With new developments in water quality monitoring methods and metagenomics, we are now keenly aware of the risks posed by microbial pathogens and, with increasing concern of DBPs from chemical addition, UV treatment has gained significant popularity as a non-chemical disinfectant with thousands of plants now operating across North America.
What does UV treatment mean for microbes and why don’t we see a decrease in ATP levels if it’s so effective as a disinfectant?
Compared to chlorine, which destroys the cell membrane, UV treatment is a physical process where UV light mutates and/or degrades DNA and RNA in bacterial and viral cells.
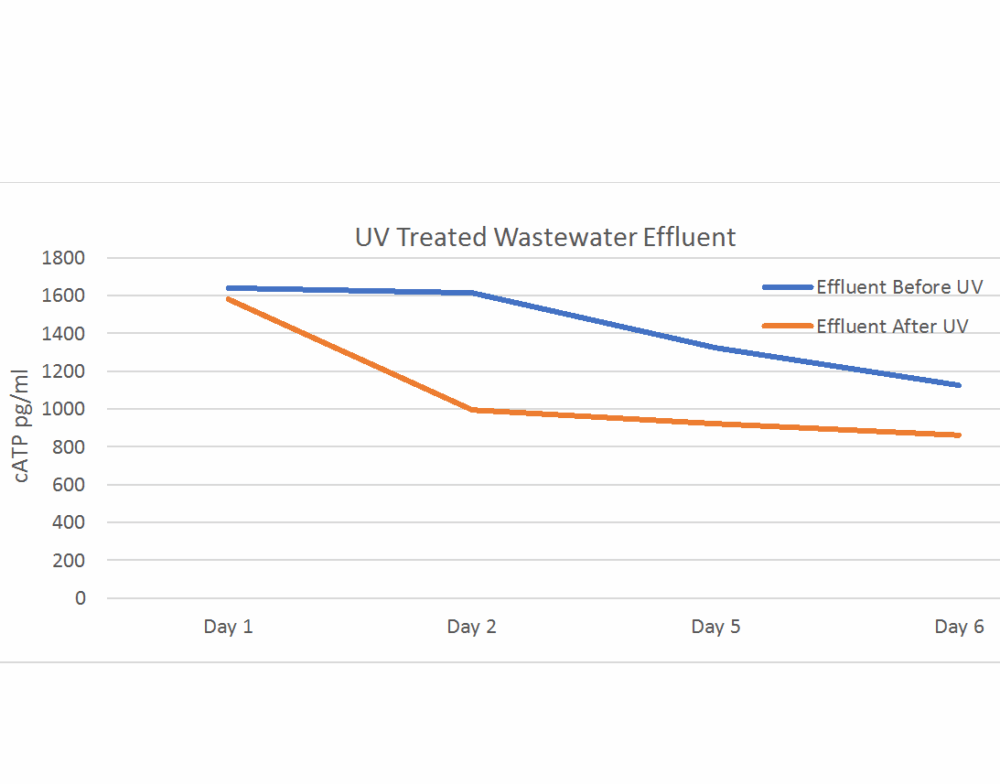
The violet-blue spectrum is most effective and 254 nm provides the maximum germicidal effect against most microbes. Although the cells remain alive, damaged DNA/RNA prevents the cell from reproducing, leaving them non-culturable and reducing the risk to consumers. This, however, makes it possible for ‘false-negatives’ to occur with traditional culture-based compliance tests. Because the bacterial concentration remains relatively consistent immediately before and after treatment, ATP – still safely within the cell membranes – often shows no significant change until hours after treatment when the cells have had time to die off. A recent trial done with UV treated wastewater effluent, showed a significant decrease in ATP levels only after 24 hours:
Research also shows that UV treated cells can enter a dormant state from which they can later wake up and begin reproducing again. This poses a potential risk for utilities relying solely on UV disinfection. Xin Yu, a researcher at the Chinese Academy of Science’s Institution of Urban Environment found that, although plate counts showed a ~99% decrease in bacterial concentration after UV treatment, qPCR demonstrated that most bacteria remained alive and retained the ability to synthesize proteins. Under the right conditions, these cells – both E.coli and P.aeruginosa – were able to come back to life and continue reproducing, suggesting that plate counts may underestimate the size of the viable population. Although the risk is low, the research confirms that UV treatment should not be relied upon alone and should be paired with low doses of disinfectants for optimal efficacy.
While ATP can’t be used to immediately gauge UV treatment efficacy, it can be used as a tool to monitor changes in the size of the total biological population over time, and under different conditions, to assess overall risk and optimize process efficiency.
Explore Luminultra resources
Make confident decisions with trusted expertise.
Discover webinars, whitepapers and expert articles focused on microbial control.
Webinar on demand | Better microbial testing for paints and coatings
Bugcount ,
Biocide management and optimization , Protect product quality , Keep lines running ,
Webinar on demand | Better microbial testing for paints and coatings
Bugcount ,
Biocide management and optimization , Protect product quality , Keep lines running ,
Luminultra introduces the Bugcount® analyzer ATP measurement platform, redefining the standard in microbial testing
The company’s flagship product combines 30 years of microbial expertise with trusted user feedback to produce a next-generation device built to streamline testing, accelerate decisions and strengthen control across critical systems.
Bugcount ,
Wastewater treatment , Drinking water , Legionella management , Microbial contamination , Efficiency loss and biofilm buildup , Biocide management and optimization , Protect product quality , Keep lines running , Stay ahead of MIC , Keep source water clean , Protect reservoir quality , Prevent biofilm build-up , Optimize biocide performance , Commercial aviation , Non-commercial aviation , Marine , Fuel storage ,
Webinar on demand | Using ATP to monitor regrowth in drinking water distribution systems
Bugcount ,
Drinking water ,

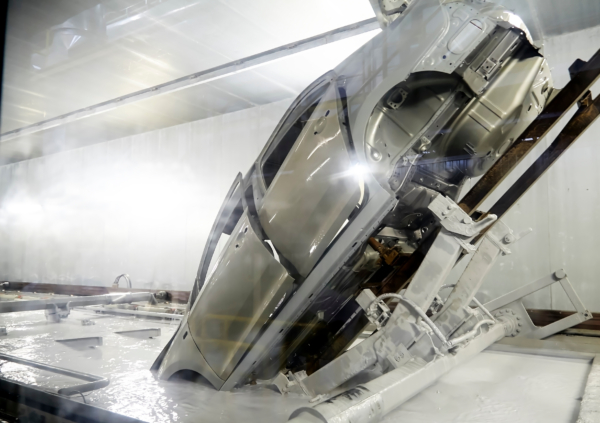
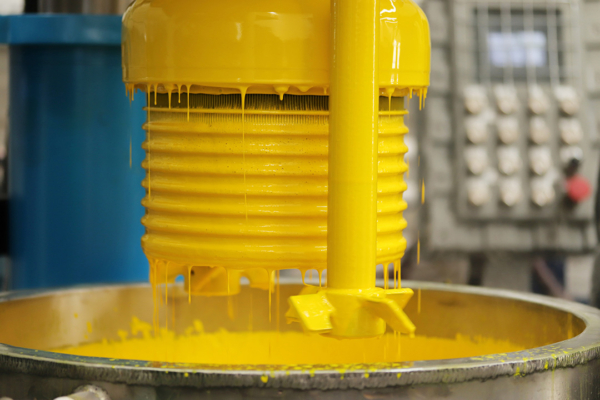
Costs and consequences of contaminated e-coat fluid in automotive manufacturing
Electrocoating (e-coat) is a cornerstone of modern automotive manufacturing, providing corrosion resistance and a uniform primer layer before painting. However, when the e-coat fluid becomes contaminated, the ripple effects can be severe—impacting product quality, operational efficiency and profitability.
Bugcount ,
Stay ahead of MIC , Keep source water clean , Protect reservoir quality ,

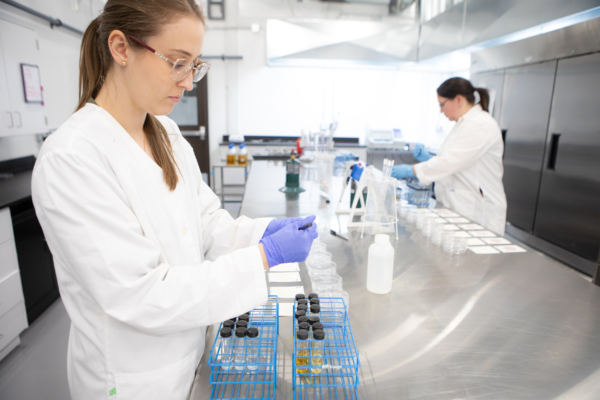
Seeing what other tests can’t: How EPCOR used ATP monitoring to strengthen drinking water operations
For drinking water utilities, keeping biologically stable water all the way to the customer’s tap is a daily challenge. Even with strong treatment processes, changes in temperature, flow, or stagnation can trigger microbial regrowth inside the distribution system. Traditionally, operators have relied on heterotrophic plate counts (HPCs) and disinfectant residuals to flag issues, but these […]
Bugcount ,
Drinking water ,
Luminultra strengthens position in European water diagnostics market with strategic acquisition of GL Biocontrol
The acquisition marks Luminultra’s eighth in eight years – each one a targeted step toward building a more comprehensive, client-focused solutions portfolio.
Bugcount , Labs ,
Drinking water , Legionella management ,
Relay™ by Luminultra
Relay™ is a value-add software tool that simplifies and guides your ATP testing, available at no cost to all customers.
Relay ,

Diagnosing inefficient biological phosphorus removal
By leveraging Luminultra’s mail-in GeneCount services, a wastewater treatment plant was able to identify the underlying causes of poor biological phosphorus removal in one of their two bioreactors.
Genecount ,
Wastewater treatment ,