


Explore our library of webinars, case studies and articles designed to help you solve microbial challenges with clarity and confidence. From practical how-tos to in-depth research, these resources give you the knowledge to make better decisions, faster.
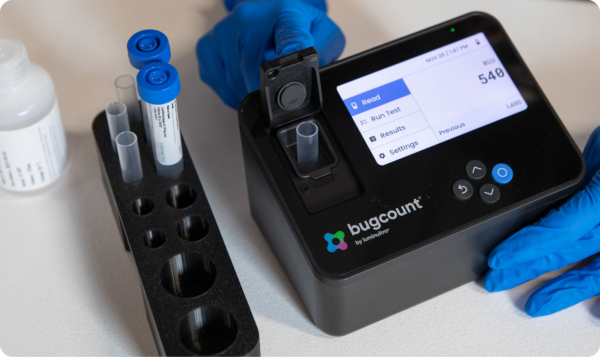
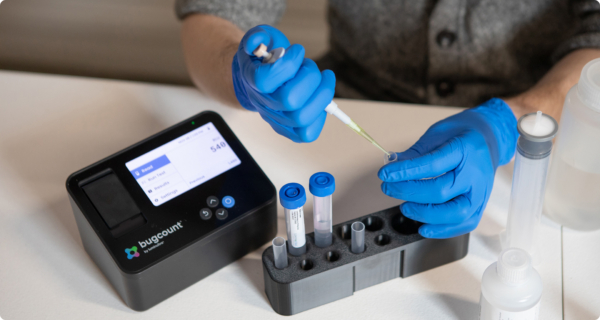
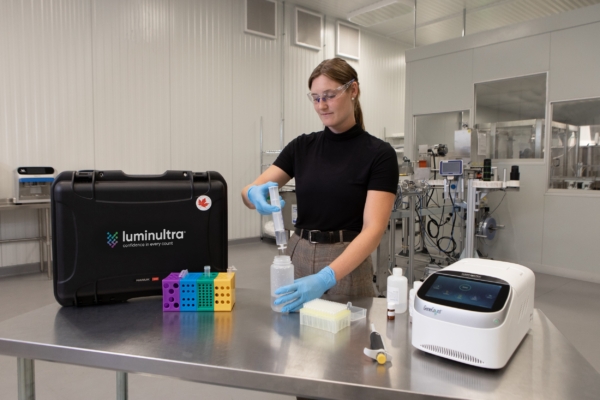
Luminultra introduces the Bugcount® analyzer ATP measurement platform, redefining the standard in microbial testing
The company’s flagship product combines 30 years of microbial expertise with trusted user feedback to produce a next-generation device built to streamline testing, accelerate decisions and strengthen control across critical systems.
Bugcount ,
Wastewater treatment , Drinking water , Legionella management , Microbial contamination , Efficiency loss and biofilm buildup , Biocide management and optimization , Protect product quality , Keep lines running , Stay ahead of MIC , Keep source water clean , Protect reservoir quality , Prevent biofilm build-up , Optimize biocide performance , Commercial aviation , Non-commercial aviation , Marine , Fuel storage ,
Upcoming webinar / Bugcount® analyzer: a live product demonstration
Tuesday, March 31 2:30 p.m. ET Register now Join Luminultra for a live demonstration of the new Bugcount® One ATP Analyzer, our latest platform for rapid microbial monitoring.
Bugcount ,
Wastewater treatment , Drinking water , Legionella management , Biocide management and optimization , Stay ahead of MIC , Keep source water clean ,
We bring microbial expertise and deep industry knowledge together to help you solve complex challenges and make confident decisions.


Whether you’re in the lab or in the field, we’re here to help you keep the work on track.

I need help getting started
Have a general inquiry or just need some direction? Send us your question and we’ll get you an answer
I need customer support
Need help with a product or test? Our customer experience team can help

Seeing what other tests can’t: How EPCOR used ATP monitoring to strengthen drinking water operations
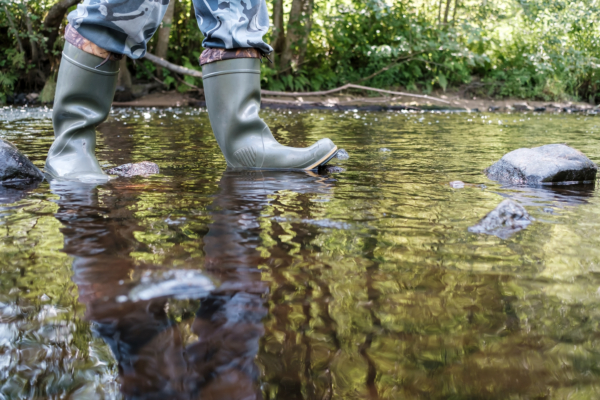
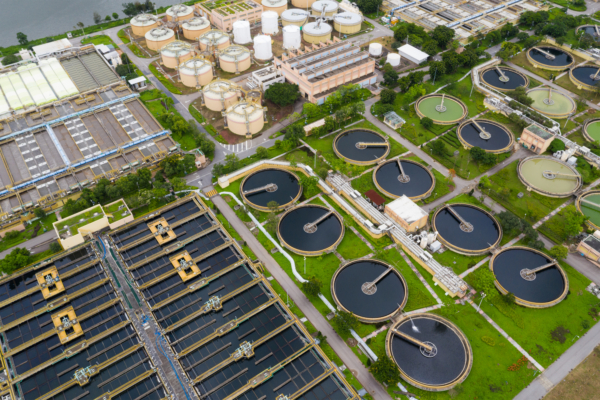
For drinking water utilities, keeping biologically stable water all the way to the customer’s tap is a daily challenge. Even with strong treatment processes, changes in temperature, flow, or stagnation can trigger microbial regrowth inside the distribution system.
Traditionally, operators have relied on heterotrophic plate counts (HPCs) and disinfectant residuals to flag issues, but these methods often cannot detect early biological changes that are happening, resulting in utilities needing to react only when a problem occurs. Operators are left feeling like they are constantly firefighting issues.
That’s what led EPCOR Water Services to test a new approach.

A 3-year, 5000-sample study on real-world ATP monitoring
Between 2019 and 2022, EPCOR collected over 5,000 samples from its two drinking water treatment plants and their respective reservoirs, twelve outlying reservoirs, and a 3,900-km chloraminated distribution network. Using Luminultra’s 2nd Generation ATP technology, the team measured total living biomass in minutes instead of days, providing a clearer and faster picture of biological activity across the system.
What they found:
1. ATP revealed what HPC missed
Over 90% of HPC samples were “non-detect,” while ATP consistently showed measurable differences in microbial activity between the treatment plant, reservoirs, and distribution network. ATP’s ability to quickly capture differences in water quality provides operators with more actionable operational guidance opportunities.
2. ATP caught infrastructure issues early
In one outlying reservoir, chlorine and turbidity remained within normal ranges even after an inspection found roof membrane ingress. ATP levels told a different story, rising before visible water-quality shifts occurred. After repairs, ATP readings dropped sharply, proof of successful corrective action.
3. Chemical parameters don’t always predict biology.
The study showed weak correlations between ATP and factors like chlorine, TOC, turbidity, and temperature. In short: good chemical numbers don’t always mean biological stability. With ATP, operators can detect early changes in microbiological activity, serving as an early warning of possible issues.
Setting actionable thresholds
From the dataset, EPCOR established clear ATP thresholds that any chloraminated system can use as a starting point:
| Control zone | ATP (pg/mL) | Recommended response |
| Good Control | < 5 | Maintain routine monitoring |
| Preventative Action | 5 – 10 | Increase sampling / inspect asset |
| Corrective Action | > 10 | Flush, disinfect, or repair |
These values give operators a tangible way to move from reactive to proactive microbial management.
Why it matters for utilities
ATP monitoring doesn’t replace compliance testing, it enhances operational awareness.
It gives you quantifiable, real-time insight into biological stability, helping to:
• Detect regrowth before taste, odor, or chlorine loss appears
• Prioritize maintenance on high-risk assets like outlying reservoirs
• Validate repairs or cleaning work in minutes
• Reduce guesswork between lab cycles
For EPCOR, ATP data has become part of its broader risk and asset management strategy, proving that rapid microbial monitoring can guide smarter operational decisions.
Curious how ATP monitoring could strengthen your own network?
Let’s start a conversation about setting thresholds that fit your system.
Explore Luminultra resources
Make confident decisions with trusted expertise.
Discover webinars, whitepapers and expert articles focused on microbial control.
Luminultra introduces the Bugcount® analyzer ATP measurement platform, redefining the standard in microbial testing
The company’s flagship product combines 30 years of microbial expertise with trusted user feedback to produce a next-generation device built to streamline testing, accelerate decisions and strengthen control across critical systems.
Bugcount ,
Wastewater treatment , Drinking water , Legionella management , Microbial contamination , Efficiency loss and biofilm buildup , Biocide management and optimization , Protect product quality , Keep lines running , Stay ahead of MIC , Keep source water clean , Protect reservoir quality , Prevent biofilm build-up , Optimize biocide performance , Commercial aviation , Non-commercial aviation , Marine , Fuel storage ,
Webinar on demand | Using ATP to monitor regrowth in drinking water distribution systems
Bugcount ,
Drinking water ,

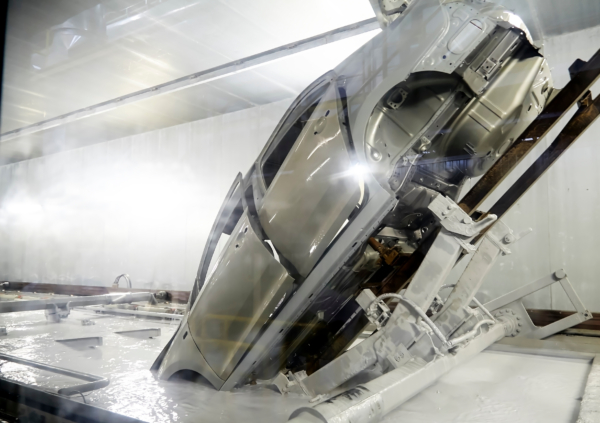
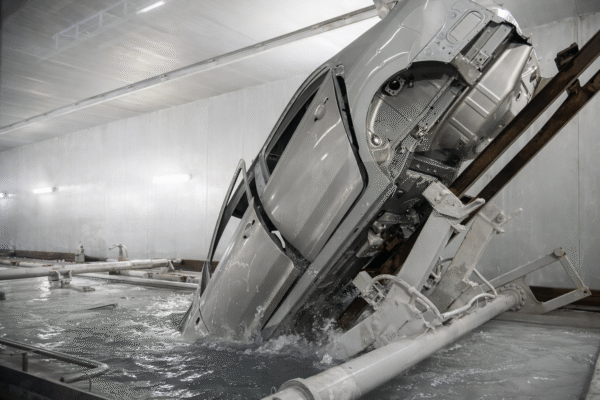
Costs and consequences of contaminated e-coat fluid in automotive manufacturing
Electrocoating (e-coat) is a cornerstone of modern automotive manufacturing, providing corrosion resistance and a uniform primer layer before painting. However, when the e-coat fluid becomes contaminated, the ripple effects can be severe—impacting product quality, operational efficiency and profitability.
Bugcount ,
Stay ahead of MIC , Keep source water clean , Protect reservoir quality ,
Luminultra strengthens position in European water diagnostics market with strategic acquisition of GL Biocontrol
The acquisition marks Luminultra’s eighth in eight years – each one a targeted step toward building a more comprehensive, client-focused solutions portfolio.
Bugcount , Labs ,
Drinking water , Legionella management ,
Relay™ by Luminultra
Relay™ is a value-add software tool that simplifies and guides your ATP testing, available at no cost to all customers.
Relay ,

Diagnosing inefficient biological phosphorus removal
By leveraging Luminultra’s mail-in GeneCount services, a wastewater treatment plant was able to identify the underlying causes of poor biological phosphorus removal in one of their two bioreactors.
Genecount ,
Wastewater treatment ,
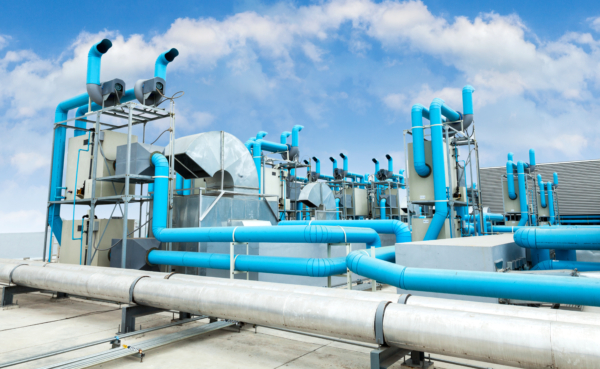
Measuring living biomass in bioreactors with ATP monitoring
Bioreactors harness the ability of naturally-occurring microorganisms to break down environmental contaminants discharged from cities and industries.
Bugcount ,
Wastewater treatment ,
Understanding loss of nitrification at a refinery wastewater treatment plant using 16S rRNA sequencing
A refinery wastewater treatment plant was monitored over several years to investigate the loss of complete nitrification.
Labs ,
Wastewater treatment ,