


Performing wastewater process audits with 2nd Generation ATP
After a 3-day audit using 2nd Generation ATP, multiple opportunities for process improvement were identified. The results allowed operators to take immediate same-day actions.
Key takeaway:
Through this audit, it was identified that an incident in the upstream manufacturing process had implications on the biomass within the wastewater treatment plant. The audit was a critical part in discovering the stress on the biomass and lead to the further investigation to identify the incident.
Introduction
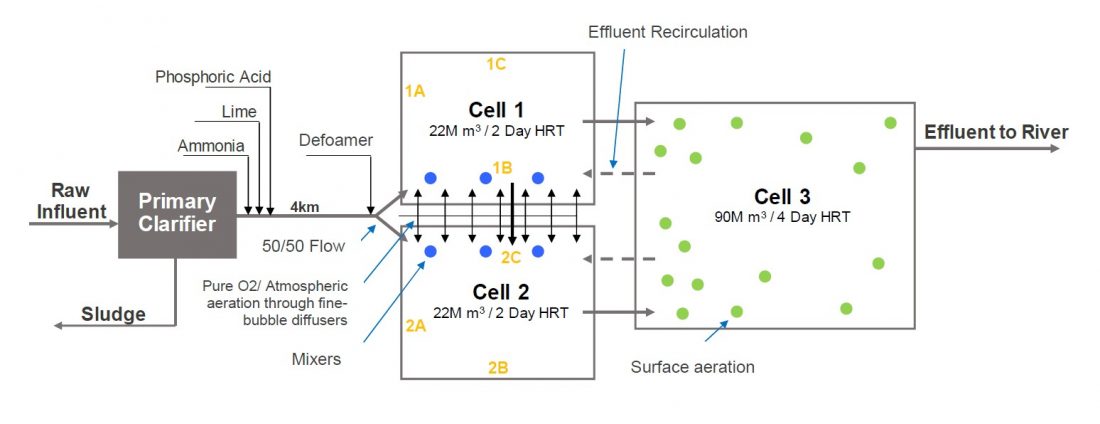
In 2015, a Canadian pulp and paper manufacturer requested that LuminUltra’s field engineers visit their site and perform a 3-day system audit using 2nd Generation ATP monitoring technology to profile the biomass throughout the wastewater plant. The goal was to learn more about what operational parameters influence the biological population in the bioreactors and identify areas where improvements could be made.
Results
This audit was successful in demonstrating several opportunities for process improvement for the multi-cell aerated basin treatment process. Results in Figure 1 demonstrate some critical findings.
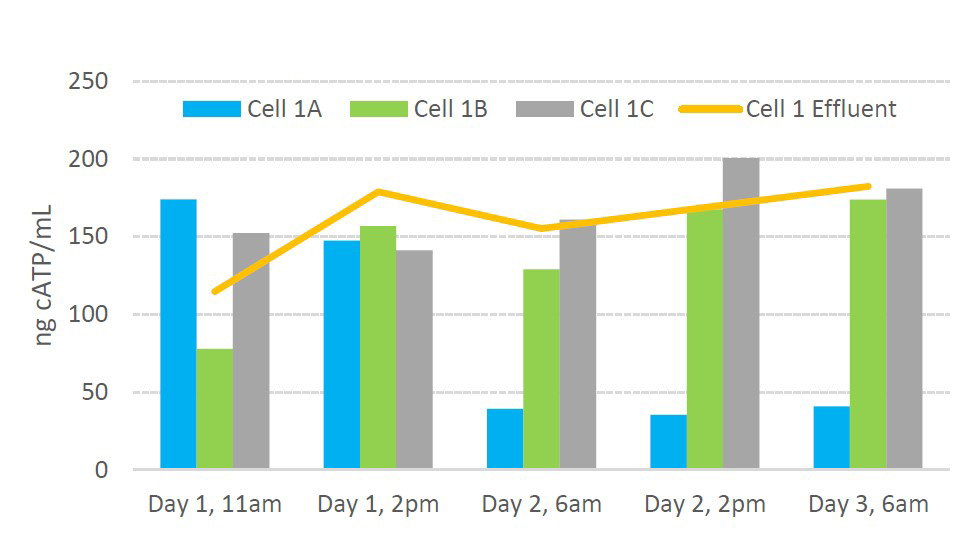
In cell 1, operators were able to identify that location 1A initially had the most biological activity. However, through days 2 and 3, it decreased significantly – indicating detrimental impact to the biological population in that area. They were also able to identify that, despite the significant decrease in 1A, the biological activity in the cell’s effluent correlated most significantly with the activity level in location 1B.
Read also: What can 2nd Gen ATP do for operators and field technicians?
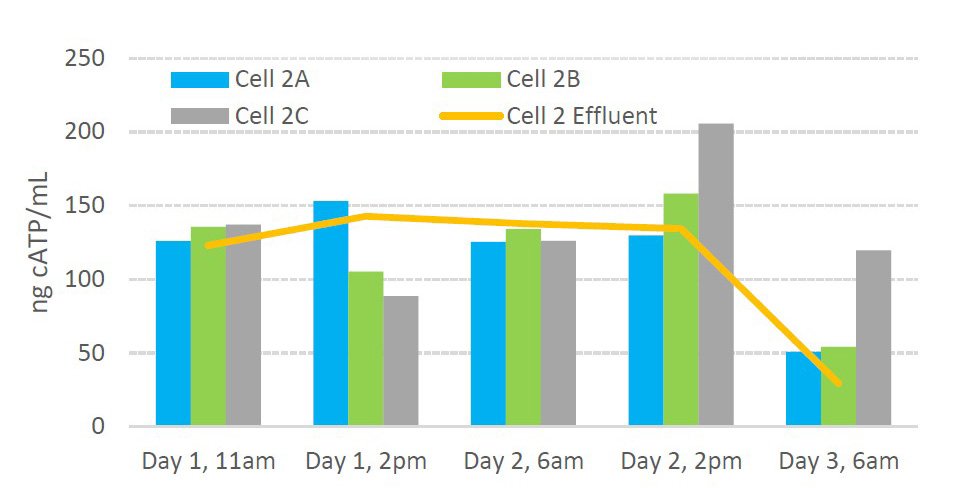
On day 3, they observed another significant decrease in biomass through cell 2 which led to reduced treatment capacity and a decrease in total activity in the cell’s effluent. Unlike cell 1 however, location C had less of an impact on cell 2’s effluent biomass concentration.
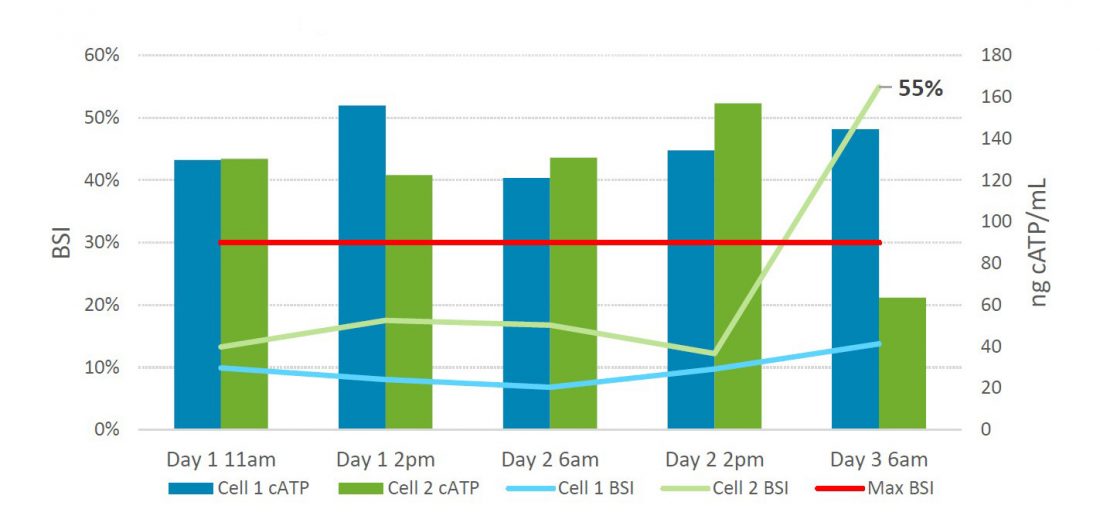
A comparison of the size of the population (cATP) and Biomass Stress Index (BSI) in each cell (Figure 3) confirmed significant biomass loss and increased stress level in cell 2 on day 3 which led to further investigation. In the end, it was found that an incident in the upstream manufacturing process unexpectedly caused stress on the biomass within the wastewater treatment plant.
Conclusion
An audit using a LuminUltra 2nd Gen ATP test kit allowed operators to quickly identify differences in biomass concentrations and stress level between process locations. The rapid results allowed operators to troubleshoot immediately and take corrective action to restore the population. As such, it serves as a valuable addition to any wastewater treatment plant’s process monitoring strategy for maintaining process stability.