Introduction
The activated sludge process is used to concentrate the biomass which naturally degrades carbonaceous substances found in most industrial and municipal wastewaters. A common practice in these plants is to err on the high-side of biomass concentration to increase capacity against “slug loading.” Although this principle is sound in that additional biomass equates to additional capacity to degrade incoming wastewater, there are various downsides to this approach, including:
- Starvation–can promote ‘sluggish’ biomass, which perform at less than peak efficiency. This can occur when the plant has accumulated too large of a biomass population or if the plant experiences low flows and/or a drop in available food.
- Poor Settling–high total solids inventory creates competition and results in advantages for filamentous microorganisms.
- Poor Mass Transfer–increased solids concentration creates additional resistance to mass transfer for aeration, decreasing efficiency and increasing power requirements.
- Increased Pumping–increased solids recirculation creates additional wear on pumps and requires more dewatering, thereby increasing energy input requirements.
- Aerobic Digestion–increasing solids concentration increases the possibility of aerobic digestion of old or dead biomass plus difficult-to-degrade wastewater constituents. Digestion of old biomass consumes costly process additives such as oxygen and, if used, supplemental nutrients.
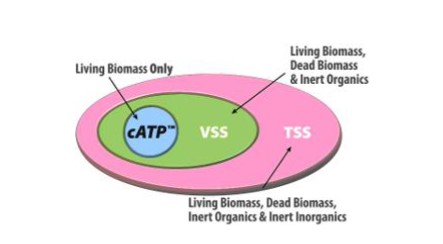
Most treatment plants control sludge age by relying on general guidelines for maintaining Mixed Liquor Suspended Solids (MLSS) or Mixed Liquor Volatile Suspended Solids (MLVSS) targets. Unfortunately, these tests do not accurately reflect the viable biomass concentration in an activated sludge system and therefore are not reliable enough to fully optimize solids inventory. MLSS cannot distinguish between biomass and other particulate matter, while MLVSS cannot distinguish between active biomass and non-cellular organic matter, unhealthy biomass, and dead biomass.
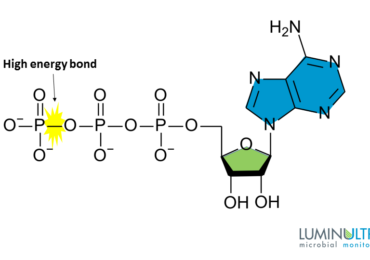
LuminUltra’s Cellular ATP (cATP) parameter –an indicator of true active biomass quantity –provides the necessary peace of mind for process operators and engineers to reduce the quantity of total solids in their system and focus more on controlling and maintaining a stable active biomass population.
Because cATP represents only the active portion of solids, it responds quickly and sensitively to process changes, especially the quantity of food entering the process.
This proposed practice is not new –more than 30 years ago, researchers from the University of Maryland (Levin et al., 1975) demonstrated the feasibility of reducing total solids inventory by relying on ATP measurements to improve treatment capacity in a municipal sewage treatment process. By reducing the return sludge flow over 40%, waste biosolids (i.e. WAS) production was reduced by 35% while BOD and TOC reduction across the plant improved.
Daily measurements of cATP can be used to quantify the active biomass in the process and confirm the presence of sufficient biomass to degrade the wastewater constituents entering the process each day. Purging the system of solids will allow active biomass to re-populate the process to create greater efficiency. In addition, fewer particles in suspension results in greater mass transfer efficiency, reducing the power required to meet a specific DO set-point.
NOTE: Solids inventory optimization may require special care in certain situations due to specific sludge age requirements (e.g. nitrification requires long sludge ages to enable nitrifying bacteria population to mature). For this reason, special care may be needed. Select a SRT suitable for the process.
Strategy
The goal of this process is to reduce the total solids inventory while maintaining the same active biomass population. During this optimization process, it is imperative that MLSS and ATP data be collected on a daily basis for all reactor and RAS locations so that process stabilization can be monitored and maintained.
1. No two biological wastewater treatment processes are exactly alike, and therefore it is recommended that a baseline of data be established for processes that are new to ATP testing. It is recommended that a baseline consist of a minimum of 20 samples taken over a 3-4 week period. It is best to initiate an optimization process when the influent wastewater composition and volumetric loading is relatively stable. This will ensure any process responses are associated with the optimization not influent changes.
2. Optimize the total solids inventory target over a period of days by using small step changes and observing the biological response.
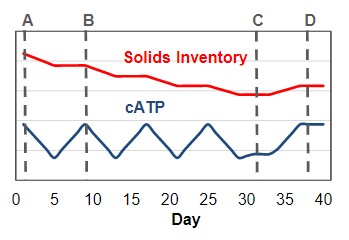 The primary method for reducing the total solids inventory will be adjustment of RAS and WAS flow rates. In this example, the inventory level is gradually decreased from its starting point (A) in a series of step changes by temporarily increasing the WAS rate while simultaneously decreasing the RAS rate to ‘purge’ the system of solids. Each change is sustained for a few days while monitoring cATP. This process of cycling the WAS removal rate will remove active biomass as well as dead biomass and non-biological solids. However, only the active biomass will grow back.
It is recommended that step changes of 10% of the total bioreactor inventory be made during each “purge.” This level is significant enough to promote a reliable change yet small enough to ensure that treatment capacity is not adversely affected. For example, if the total bioreactor inventory is 40,000 kg, then the operator would increase WAS and decrease RAS to illicit a purge of 4,000 kg of solids over a few days to arrive at an inventory level of 36,000 kg.
NOTE: It is imperative during this process that operators take measures to balance RAS and WAS flows to maintain stable sludge blanket in the secondary clarifier. A temporary increase in WAS rates without sufficient RAS rate balancing will result in degradation of the sludge blanket and could result in carry over of floc into the final effluent.
3. After each purge, monitor the response of cATP. It should gradually increase and eventually return to original baseline (B). If the population does not recover (C) or if process performance suffers after a purge, return to the previous solids inventory level and make it the new control target (D).
4. The optimization program is complete when either:
- The cATP does not recover (C), in which case return to the previous solids inventory (D)
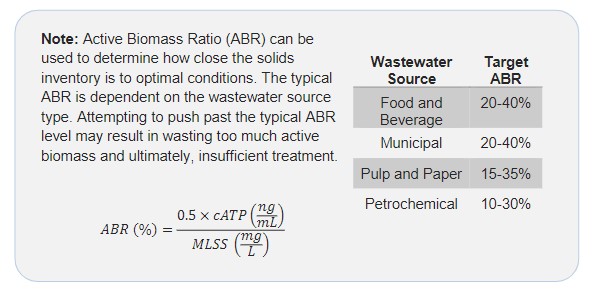
- An acceptable ABR is achieved according to the typical ranges
5. Continue intensive monitoring for at least two weeks following the optimization program while maintaining the new inventory target to ensure treatment capacity maintenance. It is important to maintain the new inventory at a stable level during this process to allow for sufficient adaptation and stabilization in ATP parameters. Focus on monitoring the cATP, BSI, ABR and effluent quality (e.g. COD, P, NH3) during this period.
6. Utilize the newly-established inventory target to establish a new set of control targets, such as F/M and SRT:
- Use the selected SRT and the new inventory target to calculate the required steady-state WAS rate. It is recommended that WAS be removed continuously rather than in ‘slugs’ as a means to promote steady-state conditions.
- Use the new inventory target and historical COD loading information to calculate the new F/M target. Focus on sCOD instead of tCOD.
7. If desired, operators can further optimize electricity consumption by optimizing dissolved oxygen targets usingthe same approach. However, the improved solids viability that is realized through this exercise should improve oxygen mass transfer without any additional effort, thereby reducing electricity requirements for aeration.
Additional guidance
If the RAS rate is too high and the WAS rate is too low
High sludge ages result. This means that aerobic sludge digestion is likely occurring which is highly inefficient and wastes energy. This condition also favors the growth of bulking filaments because of low F/M. The protruding filaments have a competitive advantage over the interior cells to obtain the relatively low levels of food.
Probable characteristics: high SVI, presence of bulking organisms, low BOD removal per unit of biomass, higher BSI.
If the RAS rate is deceased and the WAS rate is increased
Less energy is wasted by digesting aerobic sludge. The faster-growing rod-shaped bacteria out-compete the filamentous organisms for food providing that the F/M has been sufficiently increased. As a result, amore vigorous population is produced. Less new biomass is produced because the BOD of the old organisms has been removed in the WAS leaving mainly the BOD from the influent of the wastewater. With less biomass, aeration efficiency improves offering potentially greater BOD reduction per unit of biomass for the same amount of power. More than likely, greater aeration efficiency improves the degradation of particulate BOD by increasing the water stream containing extracellular enzymes over the particle surface.
Probable characteristics: good SVI, filamentous network does not predominate and within the floc structure, high BOD removal per unit of biomass, low BSI, higher cATP per mg VSS.
If the RAS rate is too low and the WAS rate is too high
The risk of lowering the treatment capacity so that it fails to treat BOD peaks becomes elevated. Furthermore, if the F/M becomes too high, the biomass will tend to deflocculate in the reactor since there is no advantage for them to remain associated in a floc. With deflocculation, solids will be lost in the clarifier as pin floc. While approaching this state is risky, it would provide the highest evolutionary selection pressure for increasing the proportion of high performance bacteria. Similarly, being too cautious reduces the proportion of high performance bacteria.
Probable characteristics: Pinfloc leading to poor settling, potential untreated waste due to insufficient biomass.
Disclaimer: This document is not a substitute for professional advice. LuminUltra and its affiliates do not accept any liability for any decisions or actions made as a consequence of using this document.